I like to say that hope is not a production strategy. You can't just push your applications to production and hope everything will be okay. You need observability: logs, traces, and metrics that tell you what's happening inside your running systems.
Spring Boot 4 introduces a really nice addition: the official spring-boot-starter-opentelemetry. This single dependency
gives you vendor-neutral observability without requiring Spring Boot Actuator. In this tutorial, I'll walk you through
everything you need to get traces, metrics, and logs flowing to Grafana.
Why This Matters
Before Spring Boot 4, getting OpenTelemetry observability meant one of three approaches:
- OpenTelemetry Java Agent – Zero code changes, but version compatibility issues
- Third-party OpenTelemetry Starter – External dependency with alpha-version libraries
- Spring Boot Actuator – Full-featured but pulls in more than you might need
The new spring-boot-starter-opentelemetry is the official Spring team solution. It leverages the modularization
work in Spring Boot 4 to give you focused observability support without the overhead of the entire Actuator module.
The key insight: it's the protocol (OTLP) that matters, not the library. Spring Boot uses Micrometer internally but exports everything via OTLP to any compatible backend.
Getting Started
Head to start.spring.io and create a new project with:
- Spring Boot 4.0.1 (or later)
- Spring Web
- OpenTelemetry
- Docker Compose Support
The Docker Compose support automatically configures the Grafana LGTM stack: Loki for logs, Grafana for visualization, Tempo for traces, and Mimir for metrics.
The Key Dependency
Your pom.xml will include:
<dependency>
<groupId>org.springframework.boot</groupId>
<artifactId>spring-boot-starter-opentelemetry</artifactId>
</dependency>
This starter includes the OpenTelemetry API, Micrometer tracing bridge, and OTLP exporters for metrics and traces.
Configuration
With Docker Compose support, Spring Boot auto-configures your OTLP endpoints. For manual configuration, add this to application.yaml:
spring:
application:
name: my-app
management:
tracing:
sampling:
probability: 1.0 # 100% for development
otlp:
metrics:
export:
url: http://localhost:4318/v1/metrics
opentelemetry:
tracing:
export:
otlp:
endpoint: http://localhost:4318/v1/traces
logging:
export:
otlp:
endpoint: http://localhost:4318/v1/logs
Port 4318 is the HTTP OTLP endpoint (use 4317 for gRPC).
What You Get Automatically
With zero additional code, you get automatic instrumentation for:
- HTTP server requests (all controller endpoints)
- HTTP client requests (RestTemplate, RestClient, WebClient)
- JDBC database calls
- Trace and span IDs in your logs
Your application logs now include trace context automatically:
2024-12-23T11:30:05.801 INFO [traceId-spanId] dev.danvega.ot.HomeController : Greeting user: World
This trace ID lets you jump from logs to traces in Grafana, or from a trace back to the exact log entries for that request.
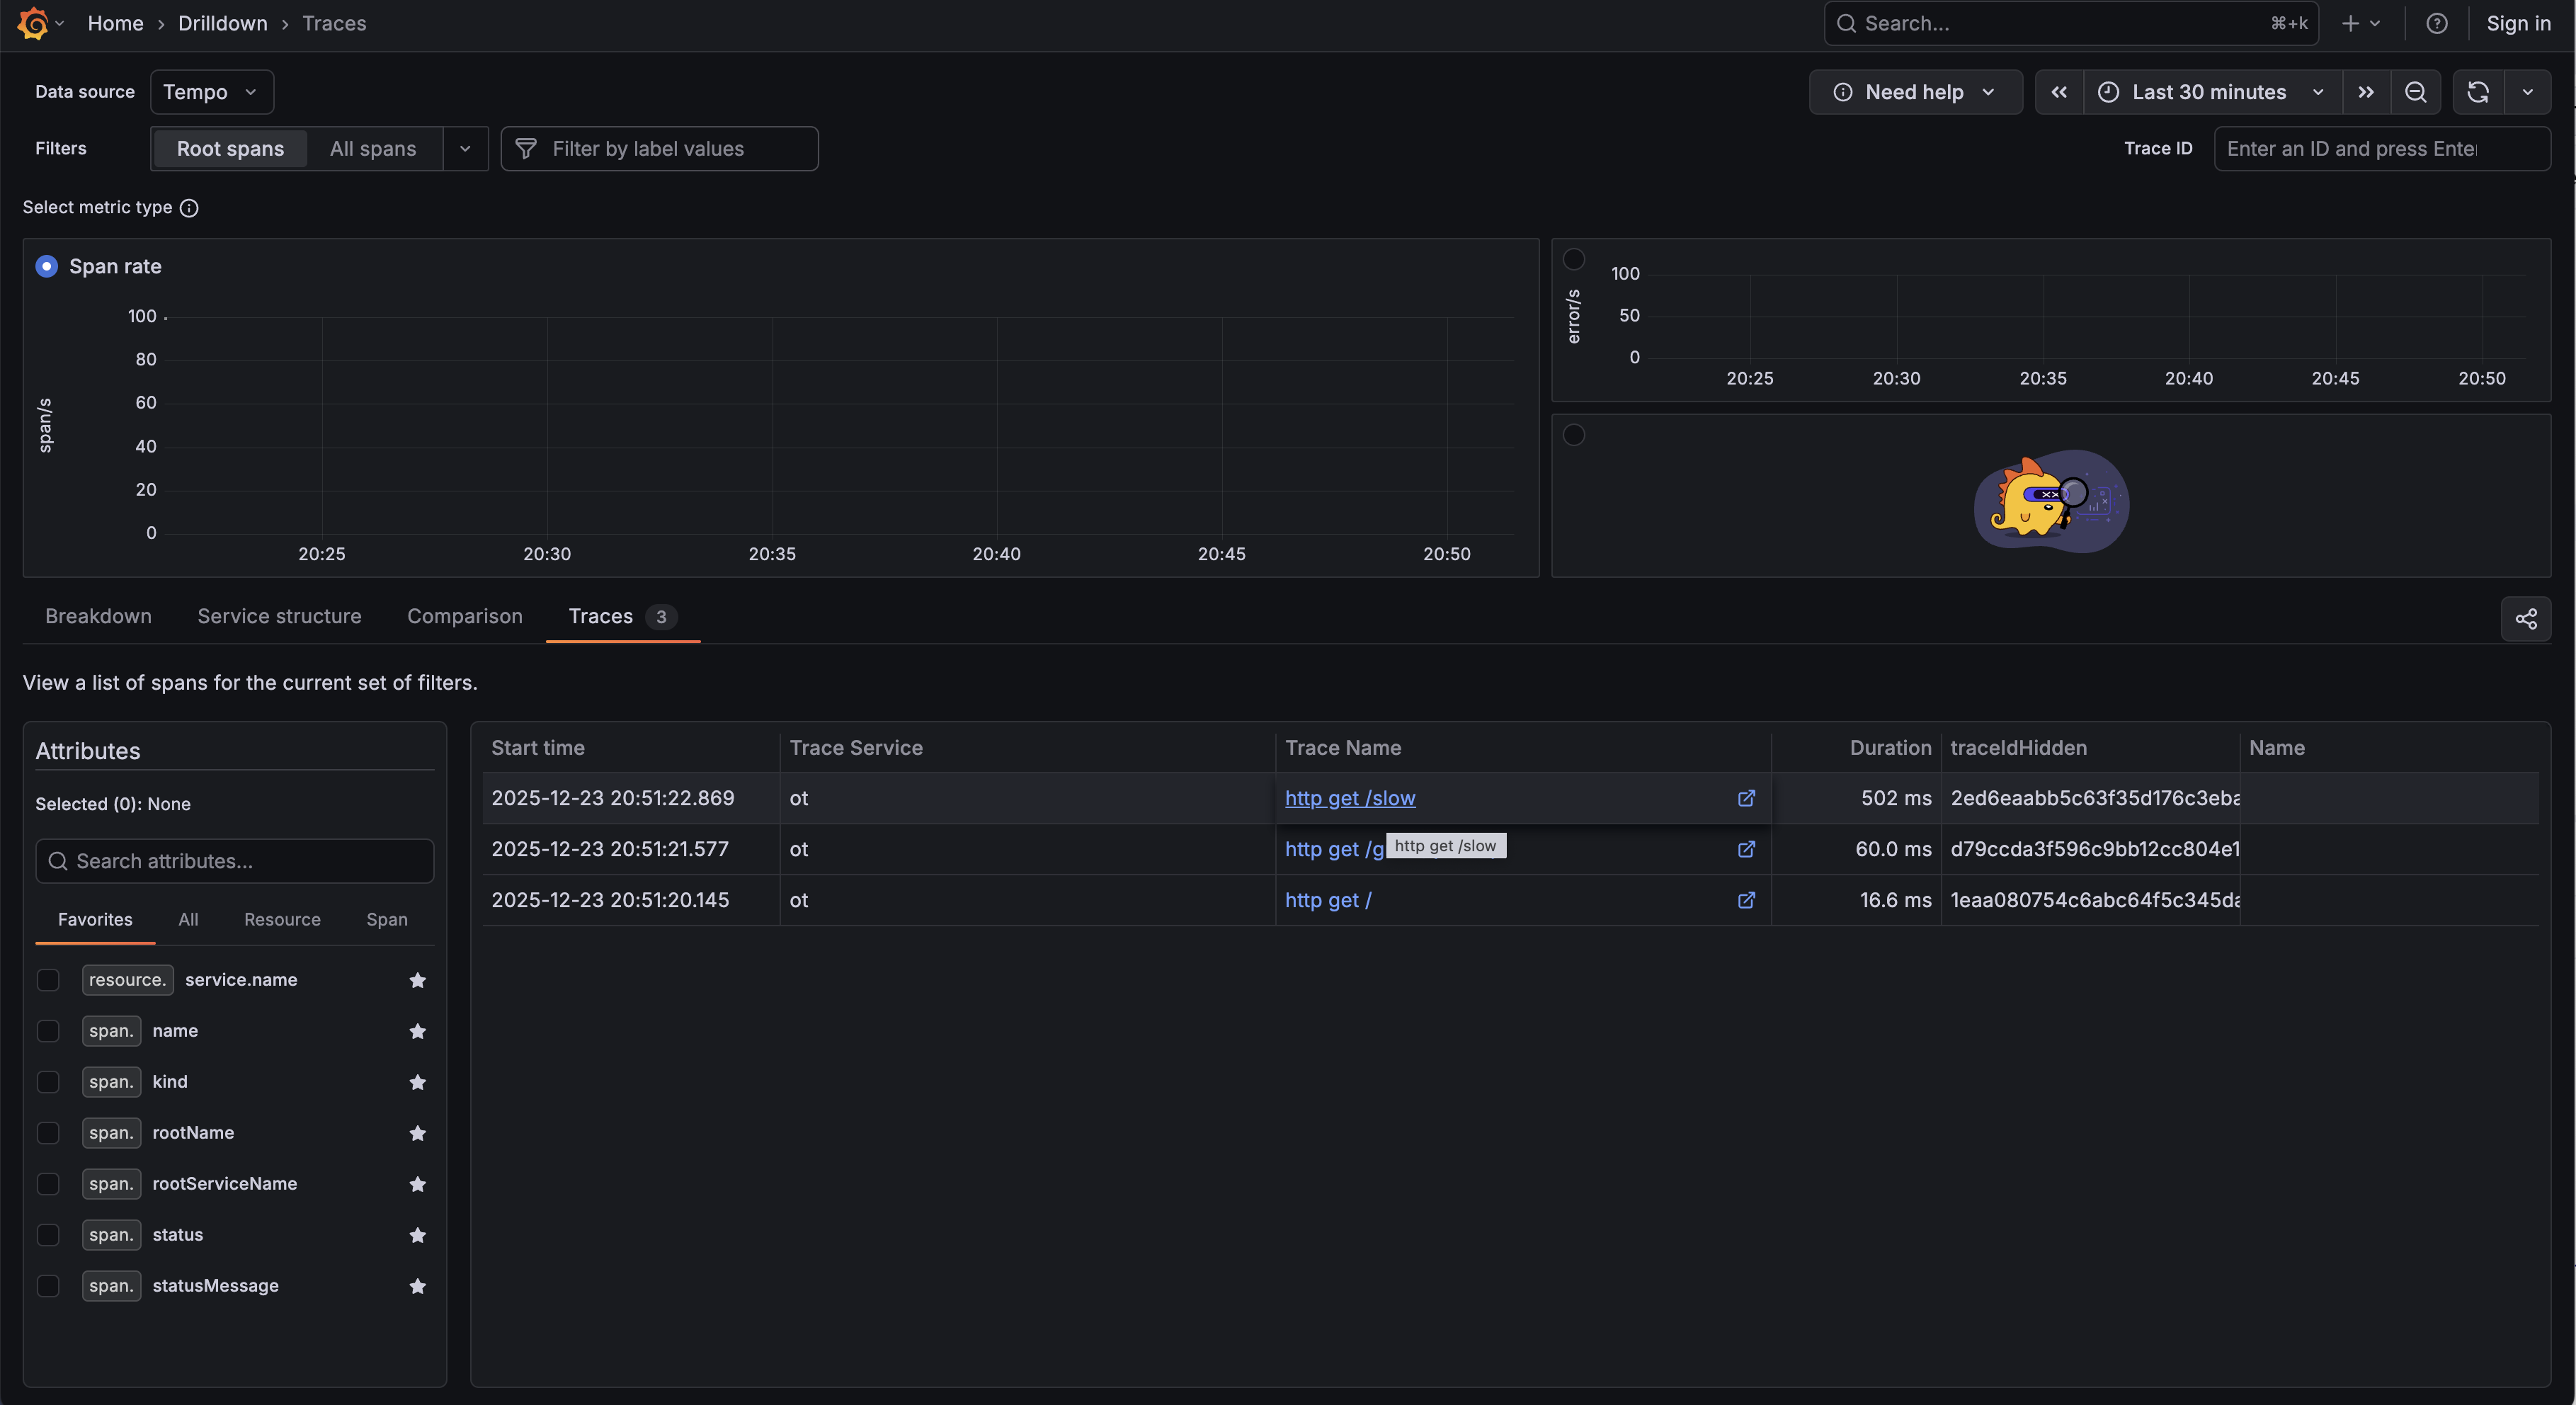
Viewing Traces and Metrics in Grafana
Run your application with ./mvnw spring-boot:run. Docker Compose starts the Grafana LGTM container automatically.
Open http://localhost:3000 and navigate to Explore. Select Tempo as your data source to view traces. Click on any trace to see the full span breakdown: how long each operation took, what HTTP status codes returned, and the complete request flow.
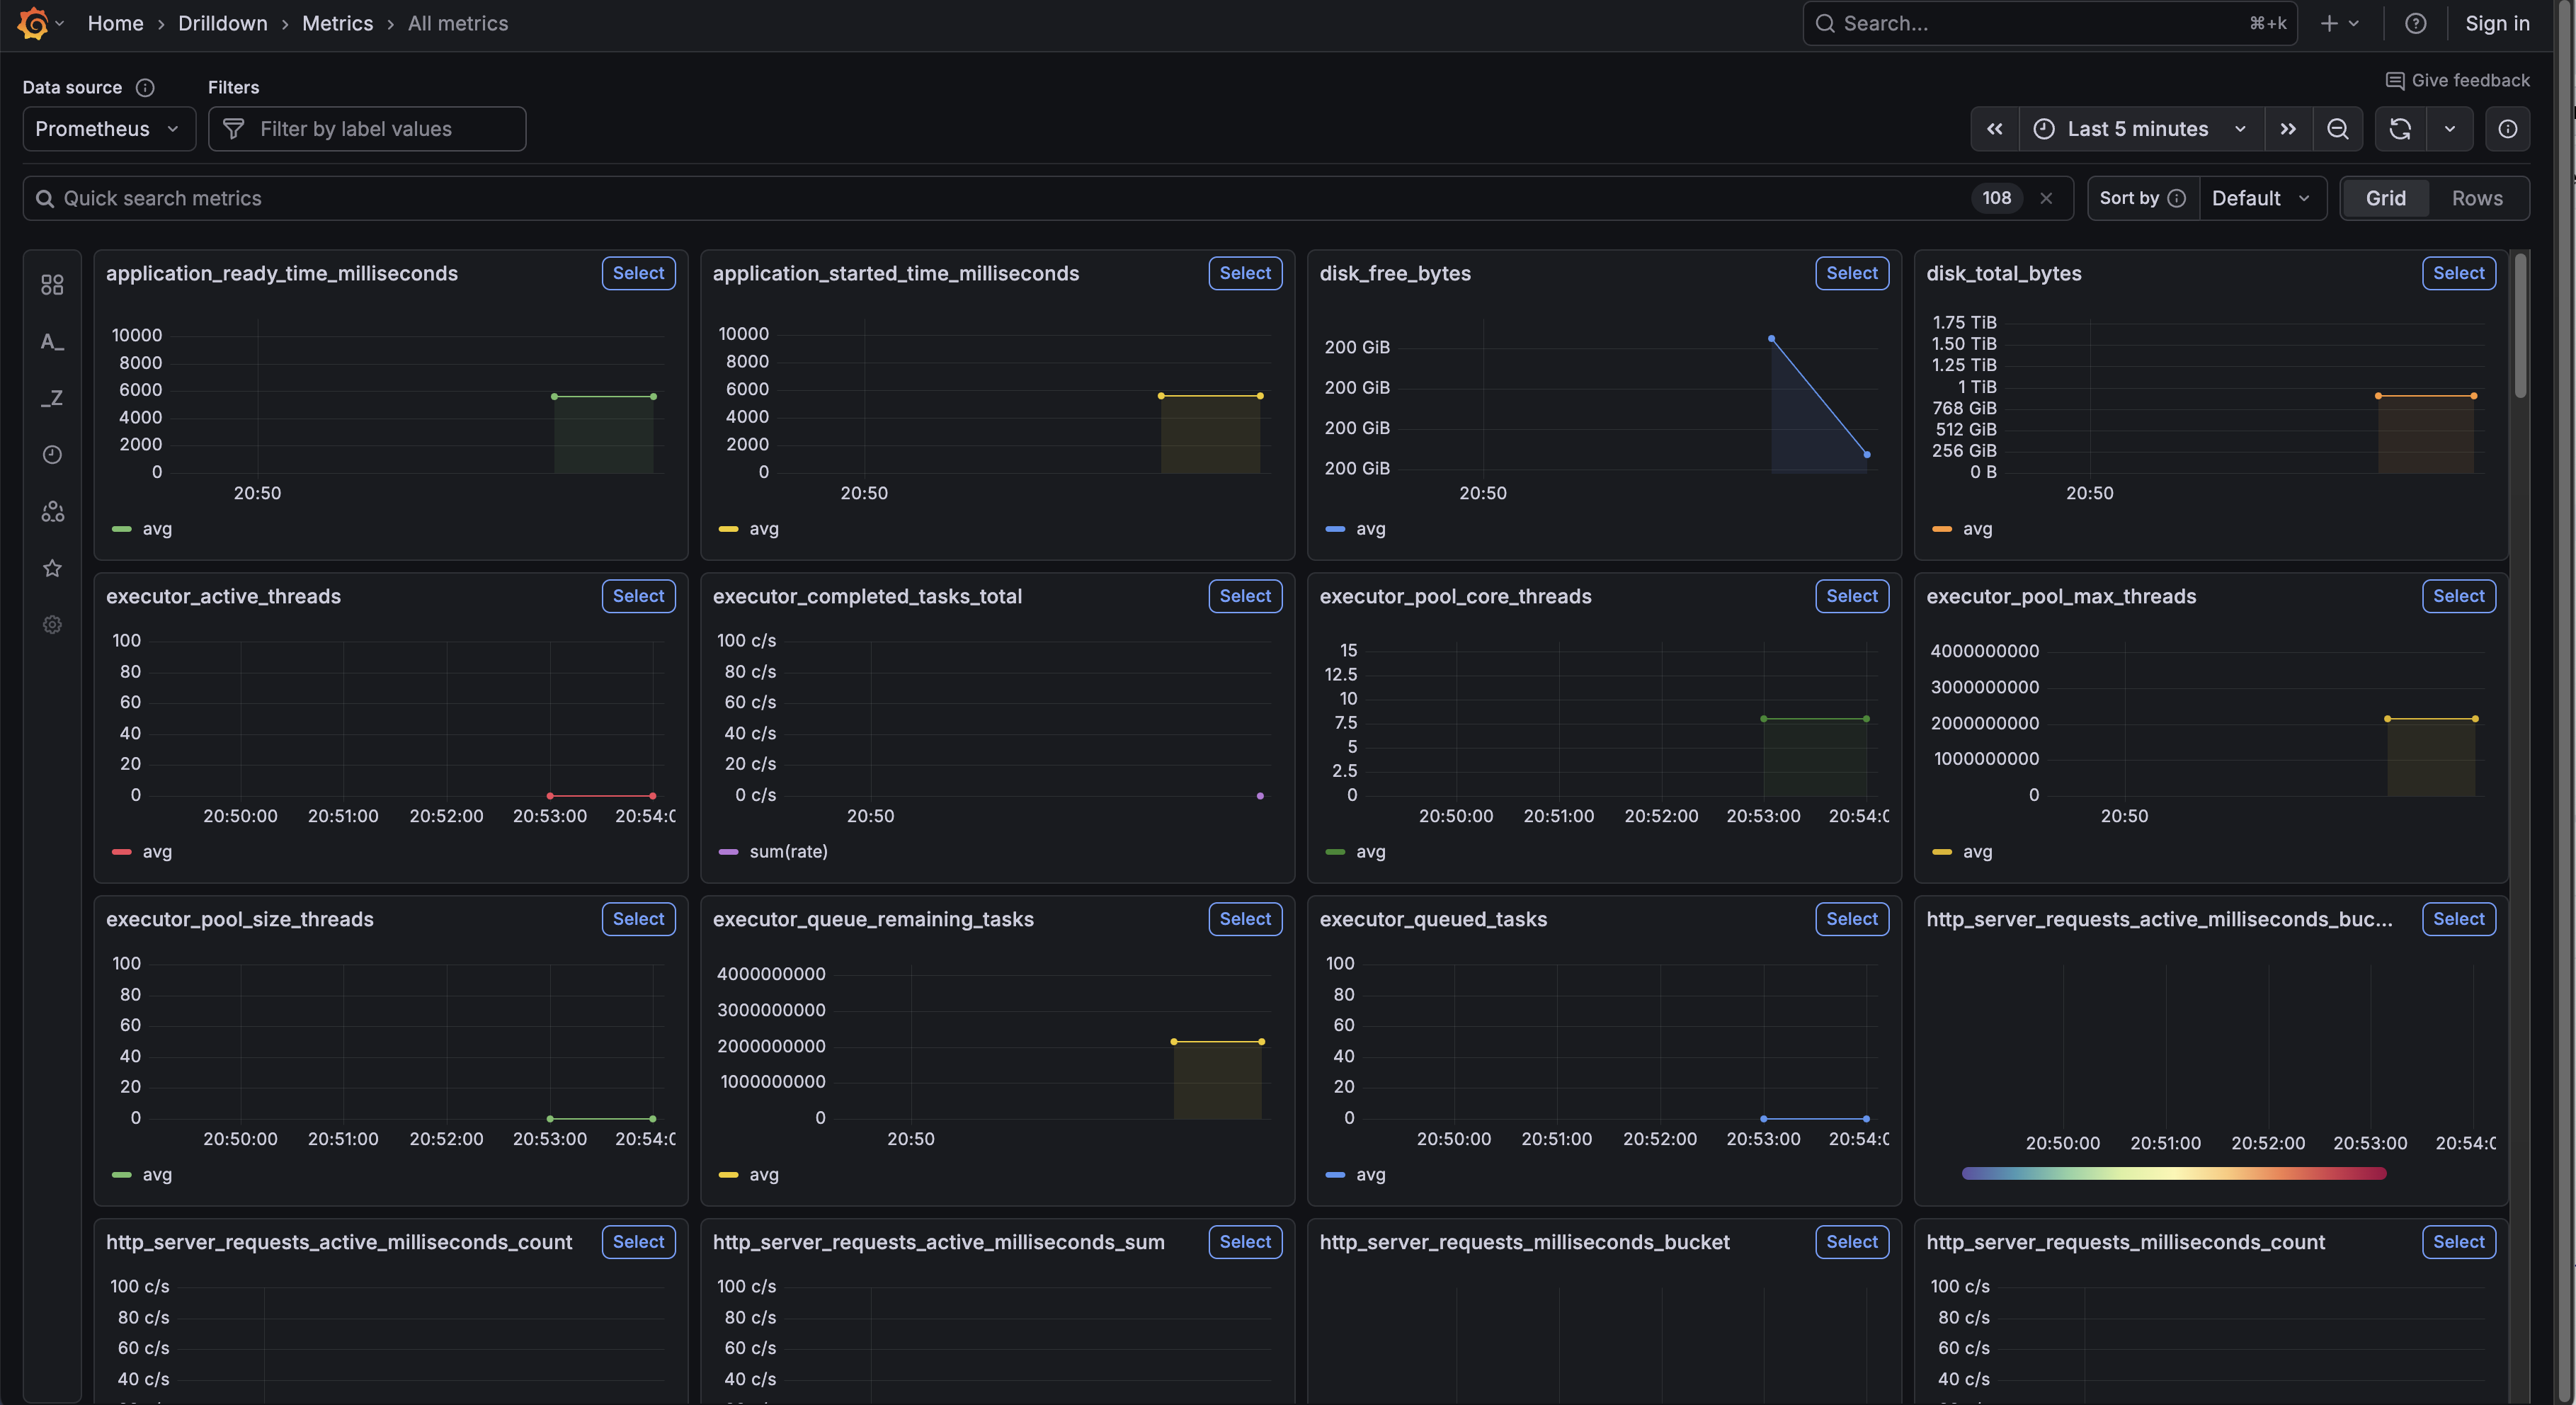
For metrics, switch to Prometheus and query built-in metrics like http_server_requests_seconds_count. Spring Boot
exposes JVM memory metrics, garbage collection stats, and HTTP request histograms out of the box.
Adding Custom Metrics
Want to track specific operations? You have two options.
Option 1: The @Observed Annotation
Add the AOP starter to your dependencies, then annotate methods:
@Observed(name = "home.count")
@GetMapping("/")
public String home() {
return "Hello World!";
}
Option 2: ObservationRegistry
For more control, inject the registry directly:
private final ObservationRegistry observationRegistry;
public void myMethod() {
Observation.createNotStarted("my-operation", observationRegistry)
.observe(() -> {
// your code here
});
}
The annotation approach keeps your code cleaner. The registry approach gives you flexibility for dynamic naming and key-value pairs.
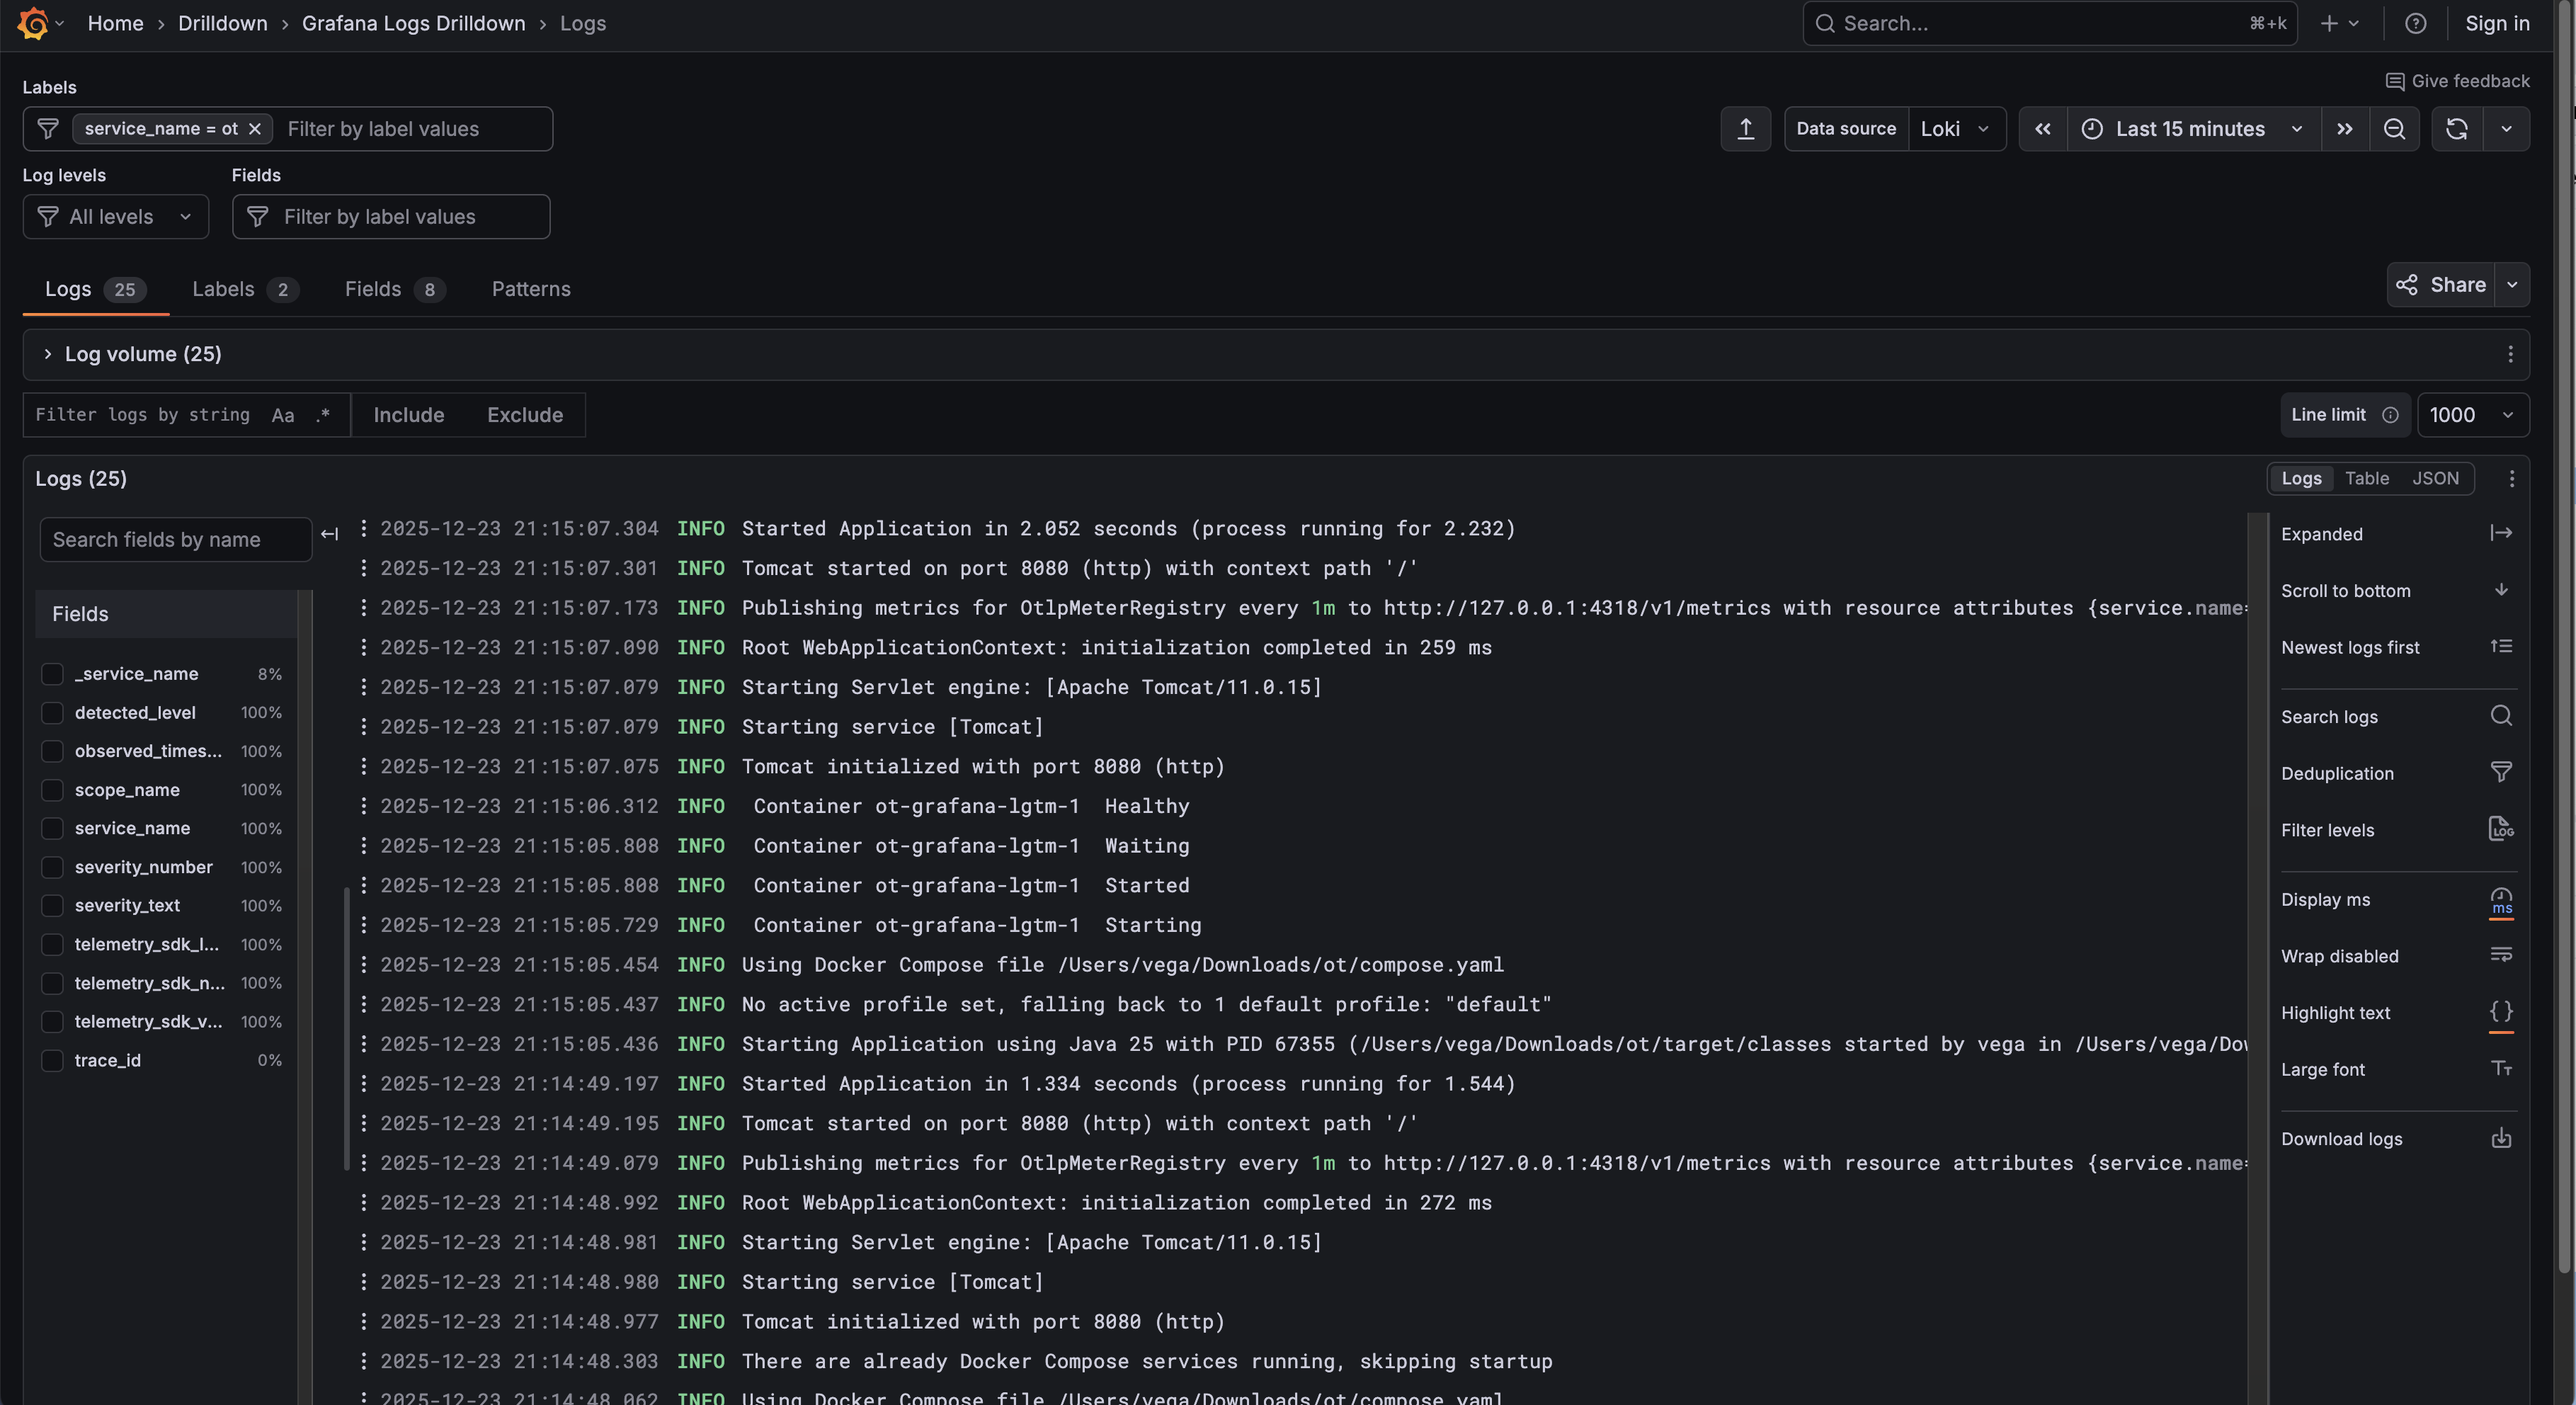
Exporting Logs via OTLP
This is where Spring Boot 4.0.1 becomes important. In 4.0.0, log export required the Actuator module. That's fixed now.
To export logs, add the Logback appender:
<dependency>
<groupId>io.opentelemetry.instrumentation</groupId>
<artifactId>opentelemetry-logback-appender-1.0</artifactId>
<version>2.21.0-alpha</version>
</dependency>
Create src/main/resources/logback-spring.xml:
<?xml version="1.0" encoding="UTF-8"?>
<configuration>
<include resource="org/springframework/boot/logging/logback/base.xml"/>
<appender name="OTEL"
class="io.opentelemetry.instrumentation.logback.appender.v1_0.OpenTelemetryAppender">
</appender>
<root level="INFO">
<appender-ref ref="CONSOLE"/>
<appender-ref ref="OTEL"/>
</root>
</configuration>
Finally, create a component to wire up the appender:
@Component
class InstallOpenTelemetryAppender implements InitializingBean {
private final OpenTelemetry openTelemetry;
InstallOpenTelemetryAppender(OpenTelemetry openTelemetry) {
this.openTelemetry = openTelemetry;
}
@Override
public void afterPropertiesSet() {
OpenTelemetryAppender.install(this.openTelemetry);
}
}
Now your logs flow to Grafana's Loki. The real power? Click on any log entry in Loki, and jump directly to the associated trace in Tempo. No more hunting through thousands of log lines to understand a failed request.
OpenTelemetry Starter vs. Spring Boot Actuator
These aren't mutually exclusive. Many production apps use both.
Choose the OpenTelemetry Starter when:
- You want vendor-neutral observability
- Distributed tracing across services is your priority
- You prefer push-based telemetry over pull-based scraping
Choose Actuator when:
- You need health checks and readiness probes for Kubernetes
- You want to expose application info, environment, or bean details
- Your monitoring stack already uses Prometheus scraping
For most new projects, I'd recommend starting with the OpenTelemetry starter and adding Actuator only if you need its specific endpoints.
For more
Conclusion
The spring-boot-starter-opentelemetry represents a significant step forward for Spring Boot observability. The
modularization work in Spring Boot 4 made this possible, giving you focused observability support without requiring
the full Actuator module.
With a single dependency, you get automatic instrumentation, OTLP export, and seamless integration with backends like Grafana's LGTM stack. Add the Logback appender for log correlation, and you have a complete observability solution that lets you trace requests from logs to traces to metrics.
If you want to learn more about What's new in Spring Boot 4, check out my this repo.
Happy coding!
Resources
Related Articles
GraphQL for Java Developers
Learn how to build scalable GraphQL APIs with Java 26 and Spring Boot 4. This course walks you through schema-first development, batch loading, unions, Query by Example, AOT repositories, and more.
Spring, Build Me a Coding Agent
Learn how to build an autonomous coding agent in Spring AI using the Spring AI Agent Utils library. This tutorial walks you through creating a CLI-based agent with file system access, shell commands, and skills.
Giving Your Spring AI Agents a Real Browser with the Browserbase Spring Boot Starter
Most AI agents can search the web. But what happens when they need to actually use it? I built a Spring Boot Starter for Browserbase that gives your agents a real, headless browser in three lines of configuration, plus a deep research agent to show it off.